Has events
Description
Specify if the chart has events. For example, you can call a Javascript function when clicking on a slice of a pie chart, or hovering over a data point on a series.
Open the UX Controls page in the UX Builder. Under Data Controls click on the [Chart] control to add it to the component. Name the chart control c1.
On the UX Code page open the Xbasic functions page and add the following.
function piedata as c (e as p) dim explodedSliceNumber as n = -1 if eval_valid("e.__javascriptFunctionResults") then dim data as p = json_parse(e.__javascriptFunctionResults) explodedSliceNumber = convert_type(data.javascriptFunctionResult, "N") end if if explodedSliceNumber >= 0 then explodedSliceNumber = explodedSliceNumber + 1 end if dim arr[0] as p i = arr.append() arr[i].sales = 10 arr[i].region = "East" arr[i].exploded = 0 i = arr.append() arr[i].sales = 20 arr[i].region = "West" arr[i].exploded = 0 i = arr.append() arr[i].sales = 15 arr[i].region = "South" arr[i].exploded = 0 i = arr.append() arr[i].sales = 8 arr[i].region = "North" arr[i].exploded = 0 if explodedSliceNumber > 0 then arr[explodedSliceNumber].exploded = 1 end if dim txt as c txt = arr.dump_properties("sales|region|exploded") piedata = txt end function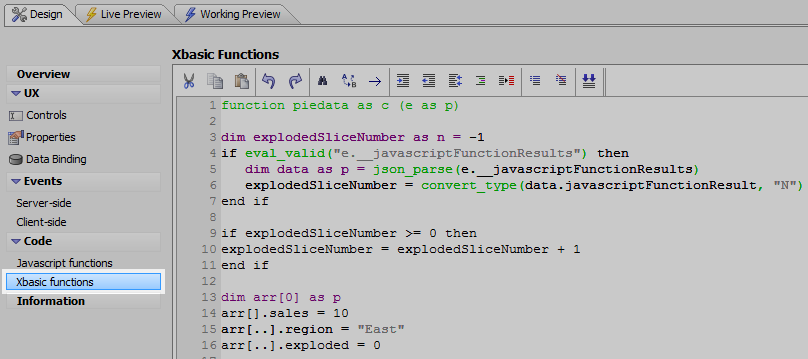 e._javascriptFunctionResults is a value of some javascript that is computed on the client-side before the callback takes place.
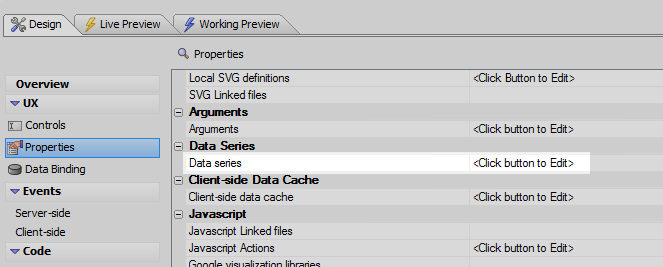
Go to the UX Properties page and in the Data Series section click on the Data series property.
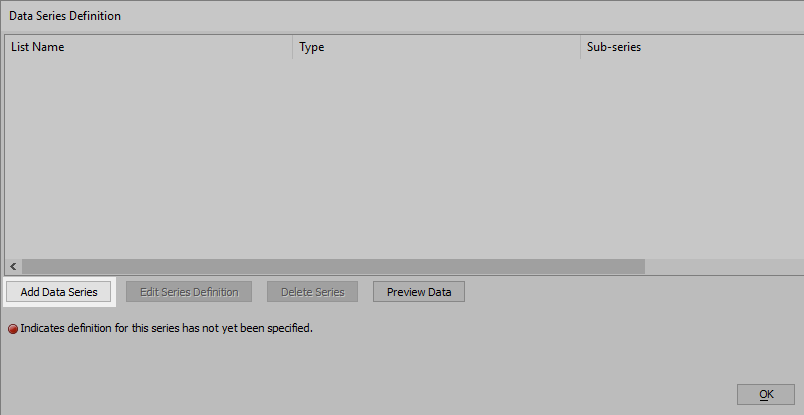
The Data Series Definition dialog will open. Click the Add Data Series button.
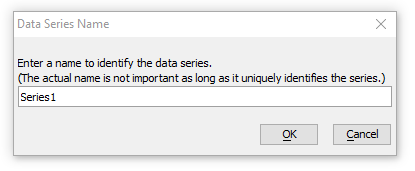
The Data Series Name dialog will open. Enter 'Series1' and click OK and OK again.
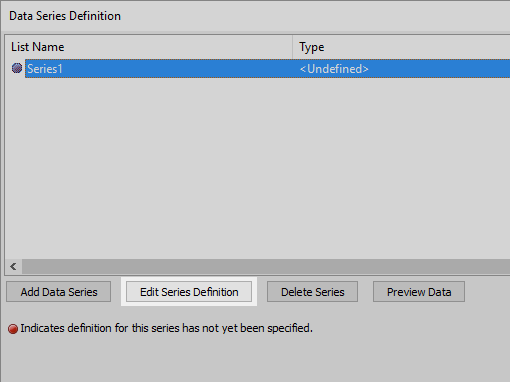
Click the 'Edit Series Definition' button.
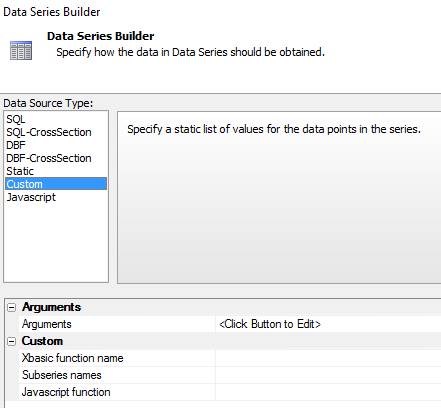
In the Data Series Builder select "Custom" as the Data Source Type.
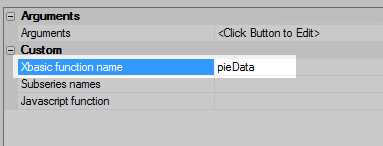
At the bottom of the Data Series Builder find the Custom properties section and set the Xbasic function name property to be "pieData"
Set the Subseries names property to "sales,region,exploded"

Set the Javascript function property to be "pieDataJs".

Go to the UX Code page and click on Javascript functions. Define the following function.
function pieDataJs() { if(typeof {dialog.object}._exploded != 'undefined') { return {dialog.object}._exploded; } else return -1; }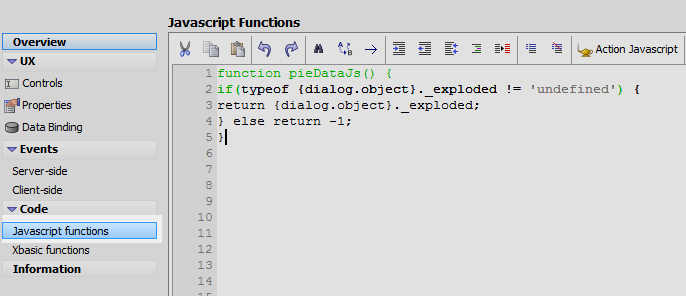 This function is called when the data series is refreshed. The value returned by this function will be submitted to the server as part of the Ajax callback.
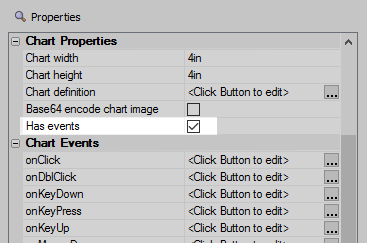
Go to the UX Controls page and in the control properties list, under the Chart properties section, check the Has events property.
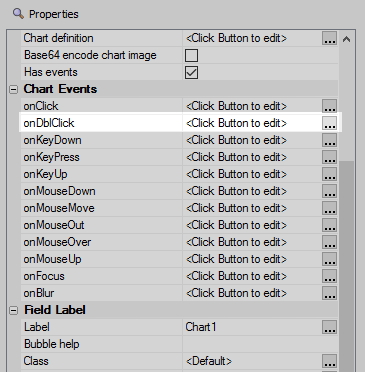
Go to the Chart Events section of the Properties list and click the [...] button next to the onDblClick property.
Add this Javascript to the onDblCLick property:
{dialog.object}._exploded = chart.pointNumber; {dialog.Object}.refreshDataSeries('Series1'); var obj = {dialog.object}.getControl('c1'); obj.refresh();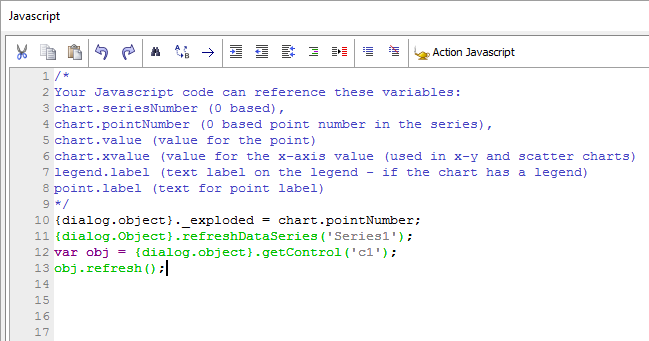 c1 is the name of the chart to refresh
Click OK to close the builder.
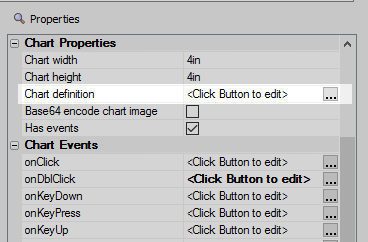
On the UX Controls page, scroll back up the properties list until you reach the Chart Properties. Click on the [...] button next to the Chart definition property.
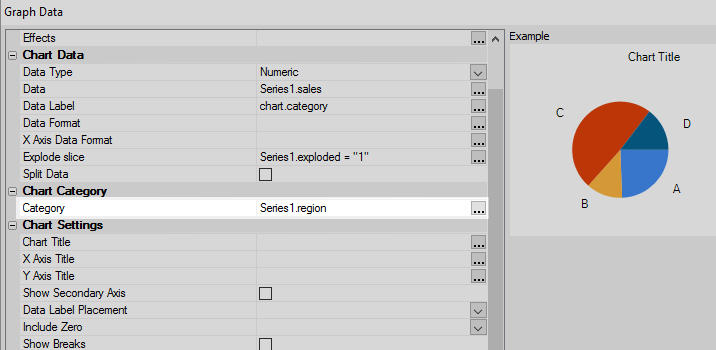
In the Chart Data section of the Graph Data dialog, click the [...] button. Click Add, then OK with the Series 1 Data Series highlighted, then set the Select Sub-series to sales and click OK and OK. You should end up with Series1.sales in the control
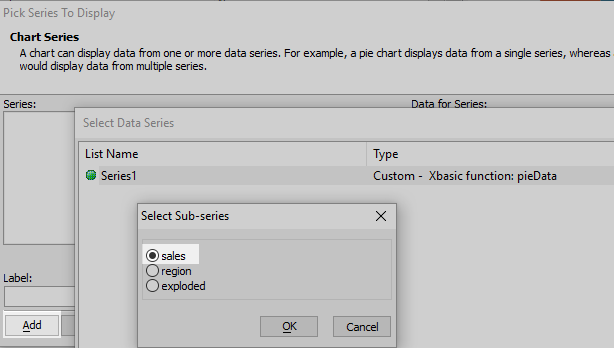 setting the Data property
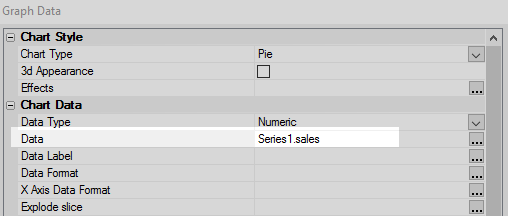 The result
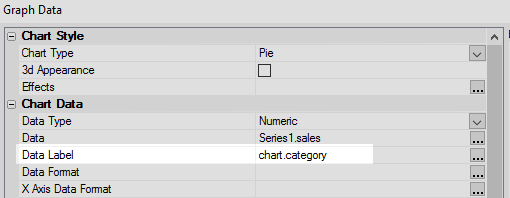
Click the [...] button and set the Data Label property to chart.category
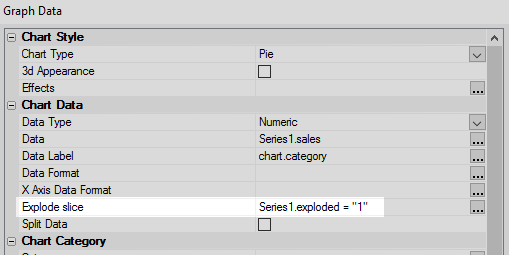
Click the [...] button and set the Explode slice property to Series1.exploded = "1"
In the Chart Category section set the Category to Series1.region and then click OK to close the graph data dialog.
Now run the component in Live Preview and then double click on different parts of the pie chart. They should explode when double clicked.
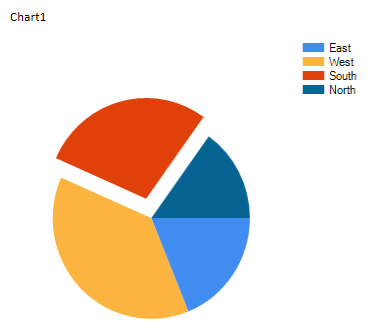 Double click to explode red
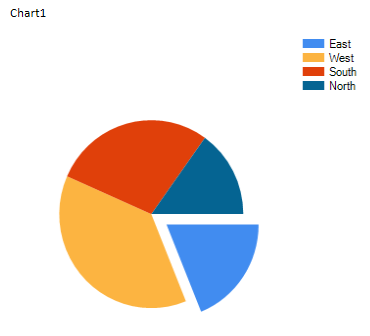 Double click on light blue to explode it